Monitor History and Logs
Reference for monitor status tracking and historical data.
Status Values
| Status | Description |
|---|---|
| Success | All configured regions report successful checks |
| Partial | Mixed results - some regions succeed, others fail |
| Fail | All configured regions report failed checks |
Event Log
The event log records status transitions. Each entry contains:
| Field | Description |
|---|---|
| Timestamp | When the status change occurred |
| Previous Status | Status before the transition |
| New Status | Status after the transition |
| Regional Snapshot | Per-region check results at transition time |
Status Transition Flow
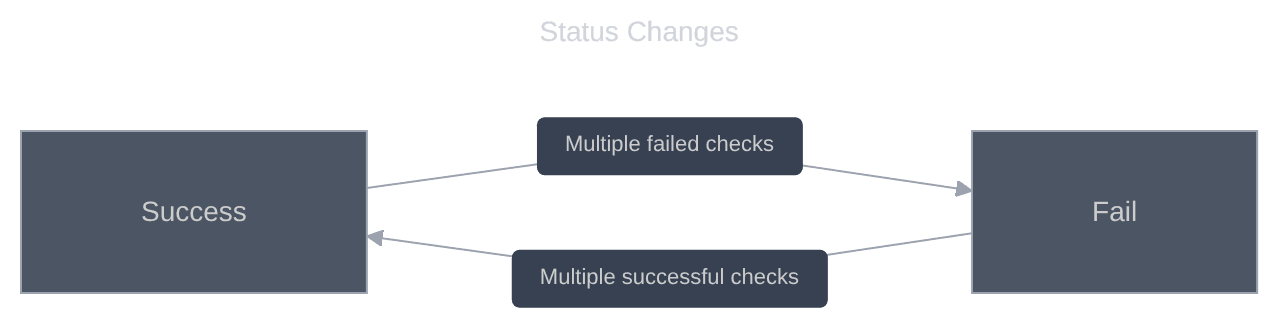
Transitions occur when:
- A region reports a failed check
- A confirmation check runs after a short delay
- All regions are evaluated
- If the aggregate status differs from current, a transition is logged
Check Result Data
Each individual check records:
| Field | Description |
|---|---|
| Region | Geographic location of the check |
| Response Time | Time to receive response (ms) |
| Status Code | HTTP status code returned |
| Success | Whether the check passed |
| Timestamp | When the check was performed |
Response Time Metrics
Monitors track response time statistics:
| Metric | Description |
|---|---|
| Average | Mean response time over the period |
| Current | Most recent check response time |
Log Retention
| Data Type | Retention |
|---|---|
| Status transitions | Indefinite |
| Individual check results | Rolling window based on plan |
| Response time data | Aggregated over time |
Accessing History
Monitor Detail View
Navigate to Monitors and select a monitor to view:
- Current status and response time
- Response time chart over time
- Recent status transitions
Log View
Click Log on a monitor to see:
- Detailed event history
- Per-region results for each transition
- Timestamp and duration information
Related Topics
- Monitor Overview - Understanding monitor concepts
- Managing Monitors - Filtering and sorting